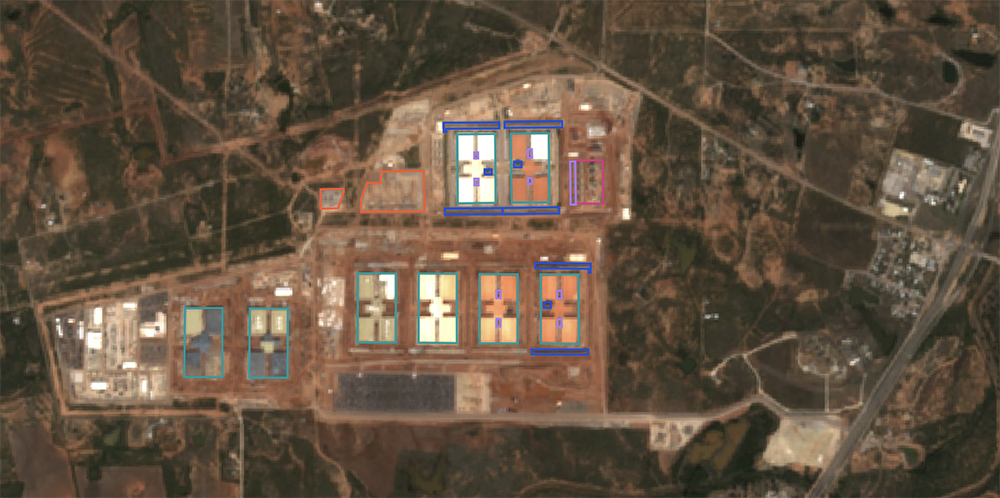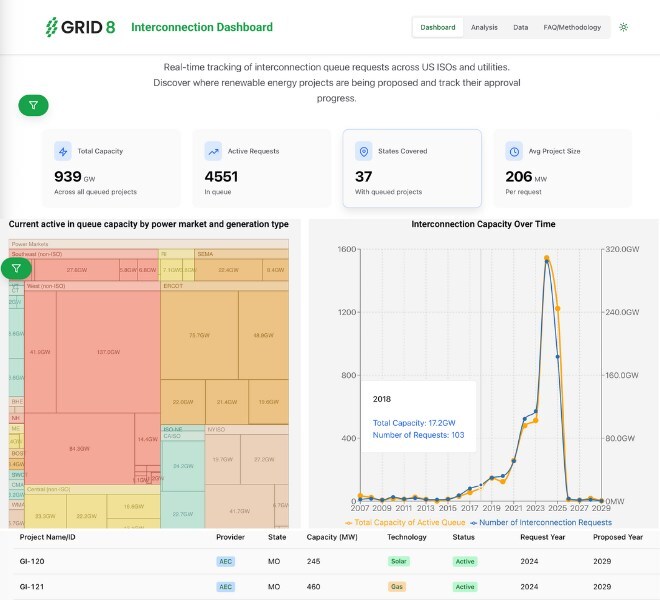
According to Grid8, the dashboard provides weekly updates and visualizes queue data by geography and generation technology, allowing users to analyze requests mapped by county, power market, and energy source. The tool supports identification of regions with high project density and potential interconnection congestion. Users can also review historical capacity trends by state and monitor grid backlog growth hotspots.
Project-level details are available, including project location, technology (such as solar, wind, or energy storage), status (active, withdrawn, operational), provider, and proposed completion timeline. Grid8 highlights that its data methodology transforms complex ISO data into consistent, clean datasets. This supports data-driven decisions for those planning US grid connections, particularly data center operators with new or expanding facilities.
“Interconnection delays are one of the biggest bottlenecks holding back US energy development and data center expansion,” said Manas Pathak, CEO of Grid8. “By making this dashboard free and publicly accessible, we’re providing developers with the information they need to find faster, cheaper paths to grid access and avoid costly surprises.”
Beyond the dashboard, Grid8 also offers AI-enabled solutions for injection or withdrawal capacity predictions, upgrade cost analysis, and optimized interconnection filing support via its primary website at www.grid8.ai.
Source: Grid8